<- back to Arduino Tutorial 2: Switches and LEDs
on to Arduino Tutorial 4: Motors ->
(adapted from Bjoern Hartmann's tutorial)
Working with analog input
This group of tutorials will help you work with the continuous input values provided by analog sensors - potentiometers, accelerometers, distance rangers, etc.
Dimmer: Fading an LED with a Potentiometer
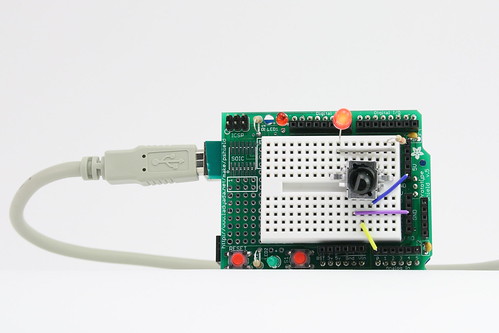
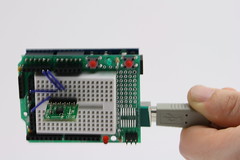
In this example we'll build a light dimmer: a knob connected to a light so that when you turn the knob, the light increases or decreases in brightness. We'll use a potentiometer (Wikipedia entry). The potentiometer has three terminals - the resistance between the first and the third terminal is constant (10k Ohms in our case). The resistance between terminals 1 and 2 (and between 2 and 3) varies as you turn the shaft of the potentiometer. If you apply 5V to terminal 1, connect terminal 3 to Ground, you will get a continuously varying voltage at terminal 2 as you turn the shaft (Why that is the case will become clearer once you've learned about voltage dividers further below).
- Connect the middle pin of the potentiometer to analog input 0, the other two to +5V and ground.
- Through a 220Ohm resistor, connect an LED to pin 9(anode or long side to resistor, cathode to pin 9)

The code for this example is led_dimmer_01
| Processing: led_dimmer_01.pde |
|
| The Processing command to read an analogvalue is arduino.analogRead(). To output PWM to the LED, use analogWrite(). |
|
/*
* Fading an LED based on Potentiometer position
*/
import processing.serial.*;
import cc.arduino.*;
Arduino arduino;
int ledPin=9;
int potPin=0;
int val;
void setup() {
size(200, 200);
arduino = new Arduino(this, Arduino.list()[1], 57600);
arduino.pinMode(ledPin, Arduino.OUTPUT);
}
void draw() {
//read potentiometer (0..1024), divide by four (0..255)
val = arduino.analogRead(potPin)/4;
//set LED PWM to read value (0..255)
arduino.analogWrite(ledPin, val);
//set Processing window background to same intensity
background(255-val,0,0);
}
|
|
Questions to answer to yourself/Extensions if you're ahead:
- why are we using (255-val) instead of val?
- hook up two LEDs, one red one green. as you turn in one direction, red gets brighter; in the other, green gets brighter. In the middle, both are off.
Drawing a graph of analog input
Let's understand better what the values are that we are reading from the analog input. To do so, here is a processing sketch that draws a graph of the sensor values over time (the code is based on the MouseSignals example you looked at for your homework).
Leave the potentiometer part of your circuit, you may take off the LED part if you want to . The code for this example is sensor_graph_01.
| Processing |
|
 |
|
/**
* Graph sensor values
* Based on MouseSignals example.
*/
import processing.serial.*;
import cc.arduino.*;
int[] xvals;
int arrayindex = 0;
Arduino arduino;
int ledPin=9;
int potPin=0;
void setup()
{
size(256, 256);
xvals = new int[width];
arduino = new Arduino(this, Arduino.list()[1], 57600);
arduino.pinMode(ledPin, Arduino.OUTPUT);
}
void draw()
{
background(0);
//shift array left by one
for(int i=1; i<width; i++) {
xvals[i-1] = xvals[i];
}
// Add the new values to the end of the array
// read potentiometer (0..1024), divide by four (0..255)
// to stay within canvas drawing limits
xvals[width-1] = arduino.analogRead(potPin)/4;
for(int i=1; i<width; i++) {
stroke(255);
point(i, 255-xvals[i]);
}
}
|
|
Arduino reports the voltage as a number between 0 and 1023. We can transform that number back into the actual voltage by calculating:
V_analog = 5.0V*(SensorReading/255.0)
sensor_graph_02 is an augmented example that prints the sensor reading and the voltage on top of the graph:
Thresholding with a Range Sensor
Thresholding is the process of turning continuous data into a discrete yes/no decision.
To learn about thresholding, we'll connect the IR range sensor. The circuit is trivial: just connect red to 5V, black to ground, and yellow to analog input 0.
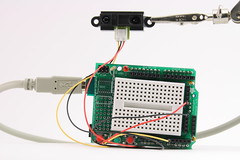
Take a look at the data the sensor returns with sensor_graph_02 - when the field of view of the sensor is clear (no obstacle - point it at the ceiling), it returns a low voltage. Move your hand high over the sensor, then start lowering it - you should see the output voltage rise, until you are about 4" away. The sensor has a range of operation of 4"-30" (More Info on Sharp Rangers).
Let's do something useful with that data. Imagine a smart cookie jar that reminds you not to snack in between meals. We could put an IR ranger into the lid. Whenever a hand comes too close, our program could play a warning sound or Flash a warning light. Working with sound requires installing an extra library into processing, so we'll start with a warning message displayed on the screen (you could always embed an LCD screen into the lid).
The code is in project ir_ranger_01
| Processing: ir_ranger_01.pde |
Flash: ir_ranger_01.fla |
 |
 |
Extensions, if you're ahead:
- Make the warning message blink.
- Replace the warning message with a blinking LED.
- Play a warning sound.
- Display another message once the hand moves out of the "danger zone".
Tilt control with an Accelerometer
In this example, we'll simulate the motion of a ball on a tilting plane in software and control the tilt through a sensor. Think of it as a first step to build your own electronic game of Labyrinth. The right sensor to use is an accelerometer. Accelerometers can report on both static and dynamic acceleration -- think of static acceleration as the angle the accelerometer is held with respect to the ground (the acceleration measured here is due to gravity). Dynamic acceleration occurs when you shake the sensor.
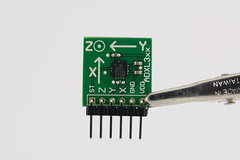
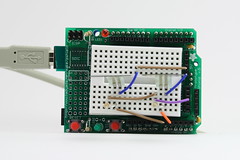
The accelerometer in your kit is a two-axis, +-2g sensor (1g is the acceleration due to gravity). It comes with 0.1" header pins that fit into the breadboard. The connections you need to make are VDD to 5V, GND to ground, and X and Y to the first two analog input pins on the Arduino board. Pin Z is not connected to anything on the accelerometer board, and you can ignore ST (self test).
Push the accelerometer into the breadboard and make the connections as shown:
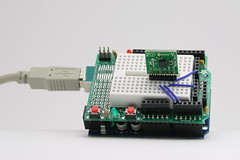
Now, get a feel for the data the accelerometer provides. Run the Processing sketch sensor_graph_03, which shows two channels of sensor data. Then pick up the Arduino+accelerometer board and tilt it in various directions. Start by holding it so that the accelerometer board is parallel to the ground. Find in which direction the X reading increases and decreases; do the same for the Y reading.
| Processing |
|
 |
|
Next, we'll replace the signal graph with another sketch that moves a ball on a 2D surface based on simple physics (x=x0+vx+1/2axt^2) (accel_ball_01).
| Processing |
|
 |
|
Further steps if you're ahead:
- Can you make the ball bounce off the wall?
- Add a target to the scene that the ball has to hit - detect when the user has sucessfully navigated the ball to the target.
Understanding Voltage Dividers with a Flex Sensor
In your kit, the potentiometer, IR distance ranger, and accelerometer are especially easy to work with since they directly output a changing voltage that can be read by one of Arduino's analog input pins.
Other sensors don't give you a varying output voltage per se, but instead change their resistance. Examples in your kit are the force sensitive resistor (FSR) and the bend or flex sensor. It is easy to get a changing voltage based on a changing resistance through a voltage divider circuit(Wikipedia page). The idea is that you put two resistors in series between power and ground: one that changes resistance (your sensor), and one of a known, fixed resistance. At the point in between the two resistors, you can measure how much the voltage has dropped through the first resistor. This value changes as the ratio of resistances between variable and fixed resistors change. More formally:

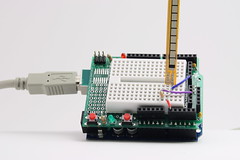
Flex sensor
The Flex sensor changes resistance between 10k Ohms (straight) and 40k Ohms (bent) (datasheet). We'll build a voltage divider circuit with a 22k resistor (red-red-orange-gold):

What kind of voltages should we expect? We'll apply the voltage divider formula to calculate voltages first, then check with our sensor_graph_02 sketch.

I measured 3.58V straight and 1.7V bent. Pretty close!
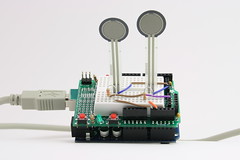
Force Sensitive Resistor (FSR) Thumb Wrestling
Just like the Flex sensor, the FSR changes resistance - in this case, when pressure is applied to the FSR (Wikipedia page). We can reuse the same circuit as before.
In this picture I built two identical voltage divider circuits for a game of thumb wrestling - we'll sense the two different pressures applied to the two FSRs and visualize who is pushing harder.
We can use sensor_graph_03 to show the output of both FSRs:

When not pressed, the voltage is 0V at the analog input pin - this suggests that the resistance of the FSR is much larger than 22k when not touched. When touched, the sensor reading goes up rapidly. This suggests that the resistance of the FSR drops as you press on it. (Convince yourself that this is the case using the voltage divider formula).
Now for our visualization:
Code: fsr_wrestling_01
| Processing |
Flash |
 |
 |
<- back to Arduino Tutorial 2: Switches and LEDs
on to
Arduino Tutorial 4: Motors
->
Comments (0)
You don't have permission to comment on this page.